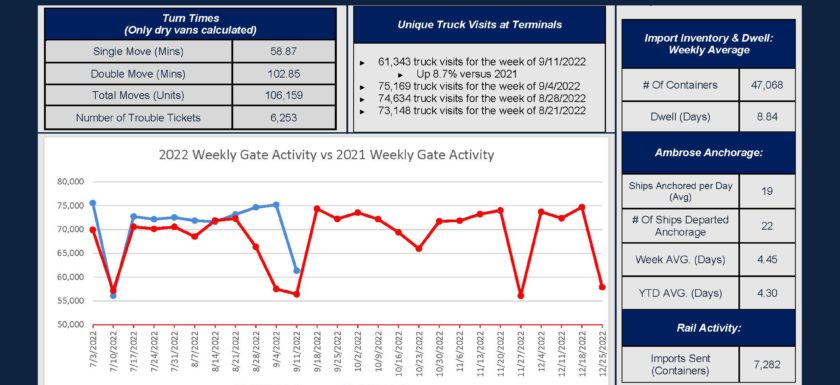
Port of New York & New Jersey has announced an updated version of its port supply chain dashboard, a tool that aims to increase efficiency and transparency at the US port.
The Port Authority of New York and New Jersey added data about Daily Average Turn Times and Weekly Import Container Dwell Time to the updated Dashboard, which were the two most requested data metrics according to a port’s survey. Average turn times are represented in minutes for single and double moves, for dry vans only, (i.e. refrigerated, HazMat, out of gauge shipments excluded).
“We have also added the number of trouble tickets and expect to add rail dwell soon,” pointed out the port authority.

Several stakeholders including shippers, truckers, trade associations, and members of the Council on Port Performance and the Port Users Group all participated in the survey and provided their feedback.
Since February of this year, the US port authority has been meeting on a weekly basis with the container terminal operators under the auspices of a Federal Maritime Commission Discussion Agreement, focussing on identifying and implementing improvements to capacity and fluidity along with increasing data sharing and transparency for the port’s customers.
 Hotline: 0944 284 082
 Email:


 VN
VN